
Introduction
Sun and Yan (2023) described a Computer-Assisted Recorded Interviewing (CARI) Machine Learning (ML) pipeline that efficiently processes 100% of recorded interviews as quickly as possible and as inexpensively as possible. The CARI ML pipeline leads to automatic identification of recordings that are at a higher risk of being falsified or exhibiting undesirable interviewer behaviors. This paper describes an extension to the pipeline that can be used to automatically detect survey questions at a higher risk of poor performance. This extension allows us to improve the efficiency of using CARI for question evaluation and testing.
As shown in Figure 1, the expanded audio pipeline includes three component processes built on machine learning: speaker diarization, speech-to-text, and acoustic feature extraction. The first two components (speaker diarization and speech-to-text) are described in detail in Sun and Yan (2023). To recap, the speaker diarization process uses Pyannote.Audio pre-trained models (Bredin et al. 2020) to determine who spoke at which turn in a question-answer sequence. The speech-to-text process uses Whisper pre-trained model (Radford et al. 2023) to transcribe conversations at turn-level. In addition to the metrics described in Sun and Yan (2023), an extension built into the pipeline enables the pipeline to generate six new measures that can be used to assess interactional difficulties, as shown in Table 1.

A second extension to the pipeline is the third component – acoustic feature extraction process. This process utilizes pre-trained models (Eyben et al. 2013, 2016) to extract acoustic parameters at turn level, which are subsequently used to predict emotions. To predict emotions, we first trained models using audio-only files from the Ryerson Audio-Visual Database of Emotional Speech and Song database (RAVDESS, Livingstone and Russo 2018). The RAVDESS data files were produced by 24 professional actors based on dialogue scripts in a neutral North American accent. The recordings were coded to indicate emotions of calm, happy, sad, angry, fearful, surprise, disgust, and neutral. We then used the off-line batch mode of openSMILE (Eyben et al. 2013) to extract the extended Geneva Minimalistic Acoustic Parameter Set (eGeMAPS) features (such as, pitch, jitter, shimmer, and loudness, and so on). We fitted a random forest model to classify the emotions by the eGeMAPS acoustic parameters. We then applied the final model to our recordings to predict the respondent’s emotions (positive, neutral, negative) at the turn immediately after the interviewer read the question.
The analytics component of the pipeline is augmented to produce outcome metrics that can be used for either monitoring interviewer performance (Sun and Yan 2023) or assessing survey questions (Table 1).
Although the CARI ML pipeline is a propriety system, the principles of it can be used by any survey researchers to assess question performance. The CARI ML pipeline has the flexibility to be used during the pilot testing phase and during the early fielding of a study in the same way survey researchers use other question evaluation methods (such as behavior coding and field test) to pretest and evaluate survey questions. Furthermore, the CARI ML pipeline can be used during data collection to monitor the performance of, say, a revised survey item, similar to how response rates are being tracked and monitored throughout data collection. The CARI ML pipeline can also be used after data collection is over to investigate the performance of survey items in the same way survey researchers use paradata to evaluate data quality. As the pipeline processes recordings of question-answering sequences, the pipeline is appropriate for evaluating and testing any type of survey item administered by interviewers intended for both household and establishment surveys. However, the pipeline is not an appropriate tool for testing and evaluating questions intended for self-administration.
In this study, we present how the expanded audio pipeline can be used to assess survey questions by describing the new outcome measures produced by the pipeline and a case study as a proof of concept using these new outcome measures to flag questions with poor performance.
Outcome measures developed for question assessment
Table 1 lists outcome measures produced by the CARI ML pipeline for question assessment purpose and describes how they are used to indicate poor question performance based on literature of interaction analysis of question-answering. A paradigmatic question-answering sequence is comprised of one turn by the interviewer who is supposed to read the survey question verbatim and one turn from the respondent who is supposed to provide an adequate response (e.g., Schaeffer and Maynard 1996). Any departure from this paradigmatic sequence indicates that there are problems with the question-answering process, speaking to the poor performance of the question. As a result, questions inducing more than one respondent turn suggest that respondents are likely to have asked for clarification, asked to repeat, and/or expressed uncertainty with answers; the more respondent turns a survey item induces, the more problematic the survey item is. In a similar vein, questions invoking more than one interviewer turn indicate that interviewers are likely to have re-read the question, probed for clarity, or provided definition or clarification, and so on. The more interviewer turns, the higher chance that the question performs poorly.
Respondents are supposed to provide an adequate response that can be mapped to one of the response options given. A long pause after the interviewer finished asking the question and before the respondent’s first turn speaks to difficulty the respondent may have had with answering the survey item. Similarly, the duration of a respondent’s first turn is also indicative of the level of difficulty the respondent may have experienced coming up with an adequate response. The longer the first turn, the more likely that the respondent has a hard time answering the question and the higher chance that the survey question needs to be improved. In addition, if the total duration of the question-answering process is longer than usual, it indicates that the interviewer and the respondent probably have made additional exchanges in order to derive a response that can be mapped to one of the response options.
Overlapping speech takes place when respondents and interviewers speak at the same time. It often happens when a respondent provides an answer or asks for clarification before the interviewer finishes reading the question. As overlapping speech is an undesirable interactional feature, frequent overlapping speech is indicative of failures or breakdowns occurring at the question-answering process.
Lastly, questions invoking negative emotions could be indicative of failures or breakdowns during the question-answering process. For instance, respondents might be feeling frustrated if the question is too hard to answer or respondents might feel embarrassed or uncomfortable if the question is too private or sensitive.
As a proof-of-concept, we applied the CARI ML pipeline to a sample of question-answering recordings. We used these outcome measures to rank the questions and to identify the five worst performing items on each outcome. We conducted an expert review of the items and used expert ratings to validate the ability of these outcome measures to detect questions with the worst performance.
Data
We randomly selected 479 recordings of question-answering sequences from a large-scale cross-sectional study of a nationally representative sample of establishments. The 479 recordings represent 20 survey questions and 53 respondents interviewed by four interviewers (three female and one male). The 20 survey items vary in question format; 13 questions are closed-ended and seven open-ended. Among the 13 closed-end questions, six items require one answer and seven are check-all-that-apply type of items. Furthermore, a showcard is used for nine out of 20 questions.
We processed the recordings through the CARI ML pipeline, which automatically generated the seven outcome measures described in Table 1. Each of the seven outcome measures is aggregated to the question level for question assessment purpose.
To validate the pipeline results, two survey methodologists conducted an expert review of the 20 questions and rated the questions in terms of difficulty using a five-point scale where 1 means not at all difficult and 5 mean the most difficult. The weighted kappa between the two raters is 0.87. We took an average of the two ratings for each item to be used as the benchmark for evaluating the pipeline and displayed the ratings in Table 2 together with question level characteristics.
Results
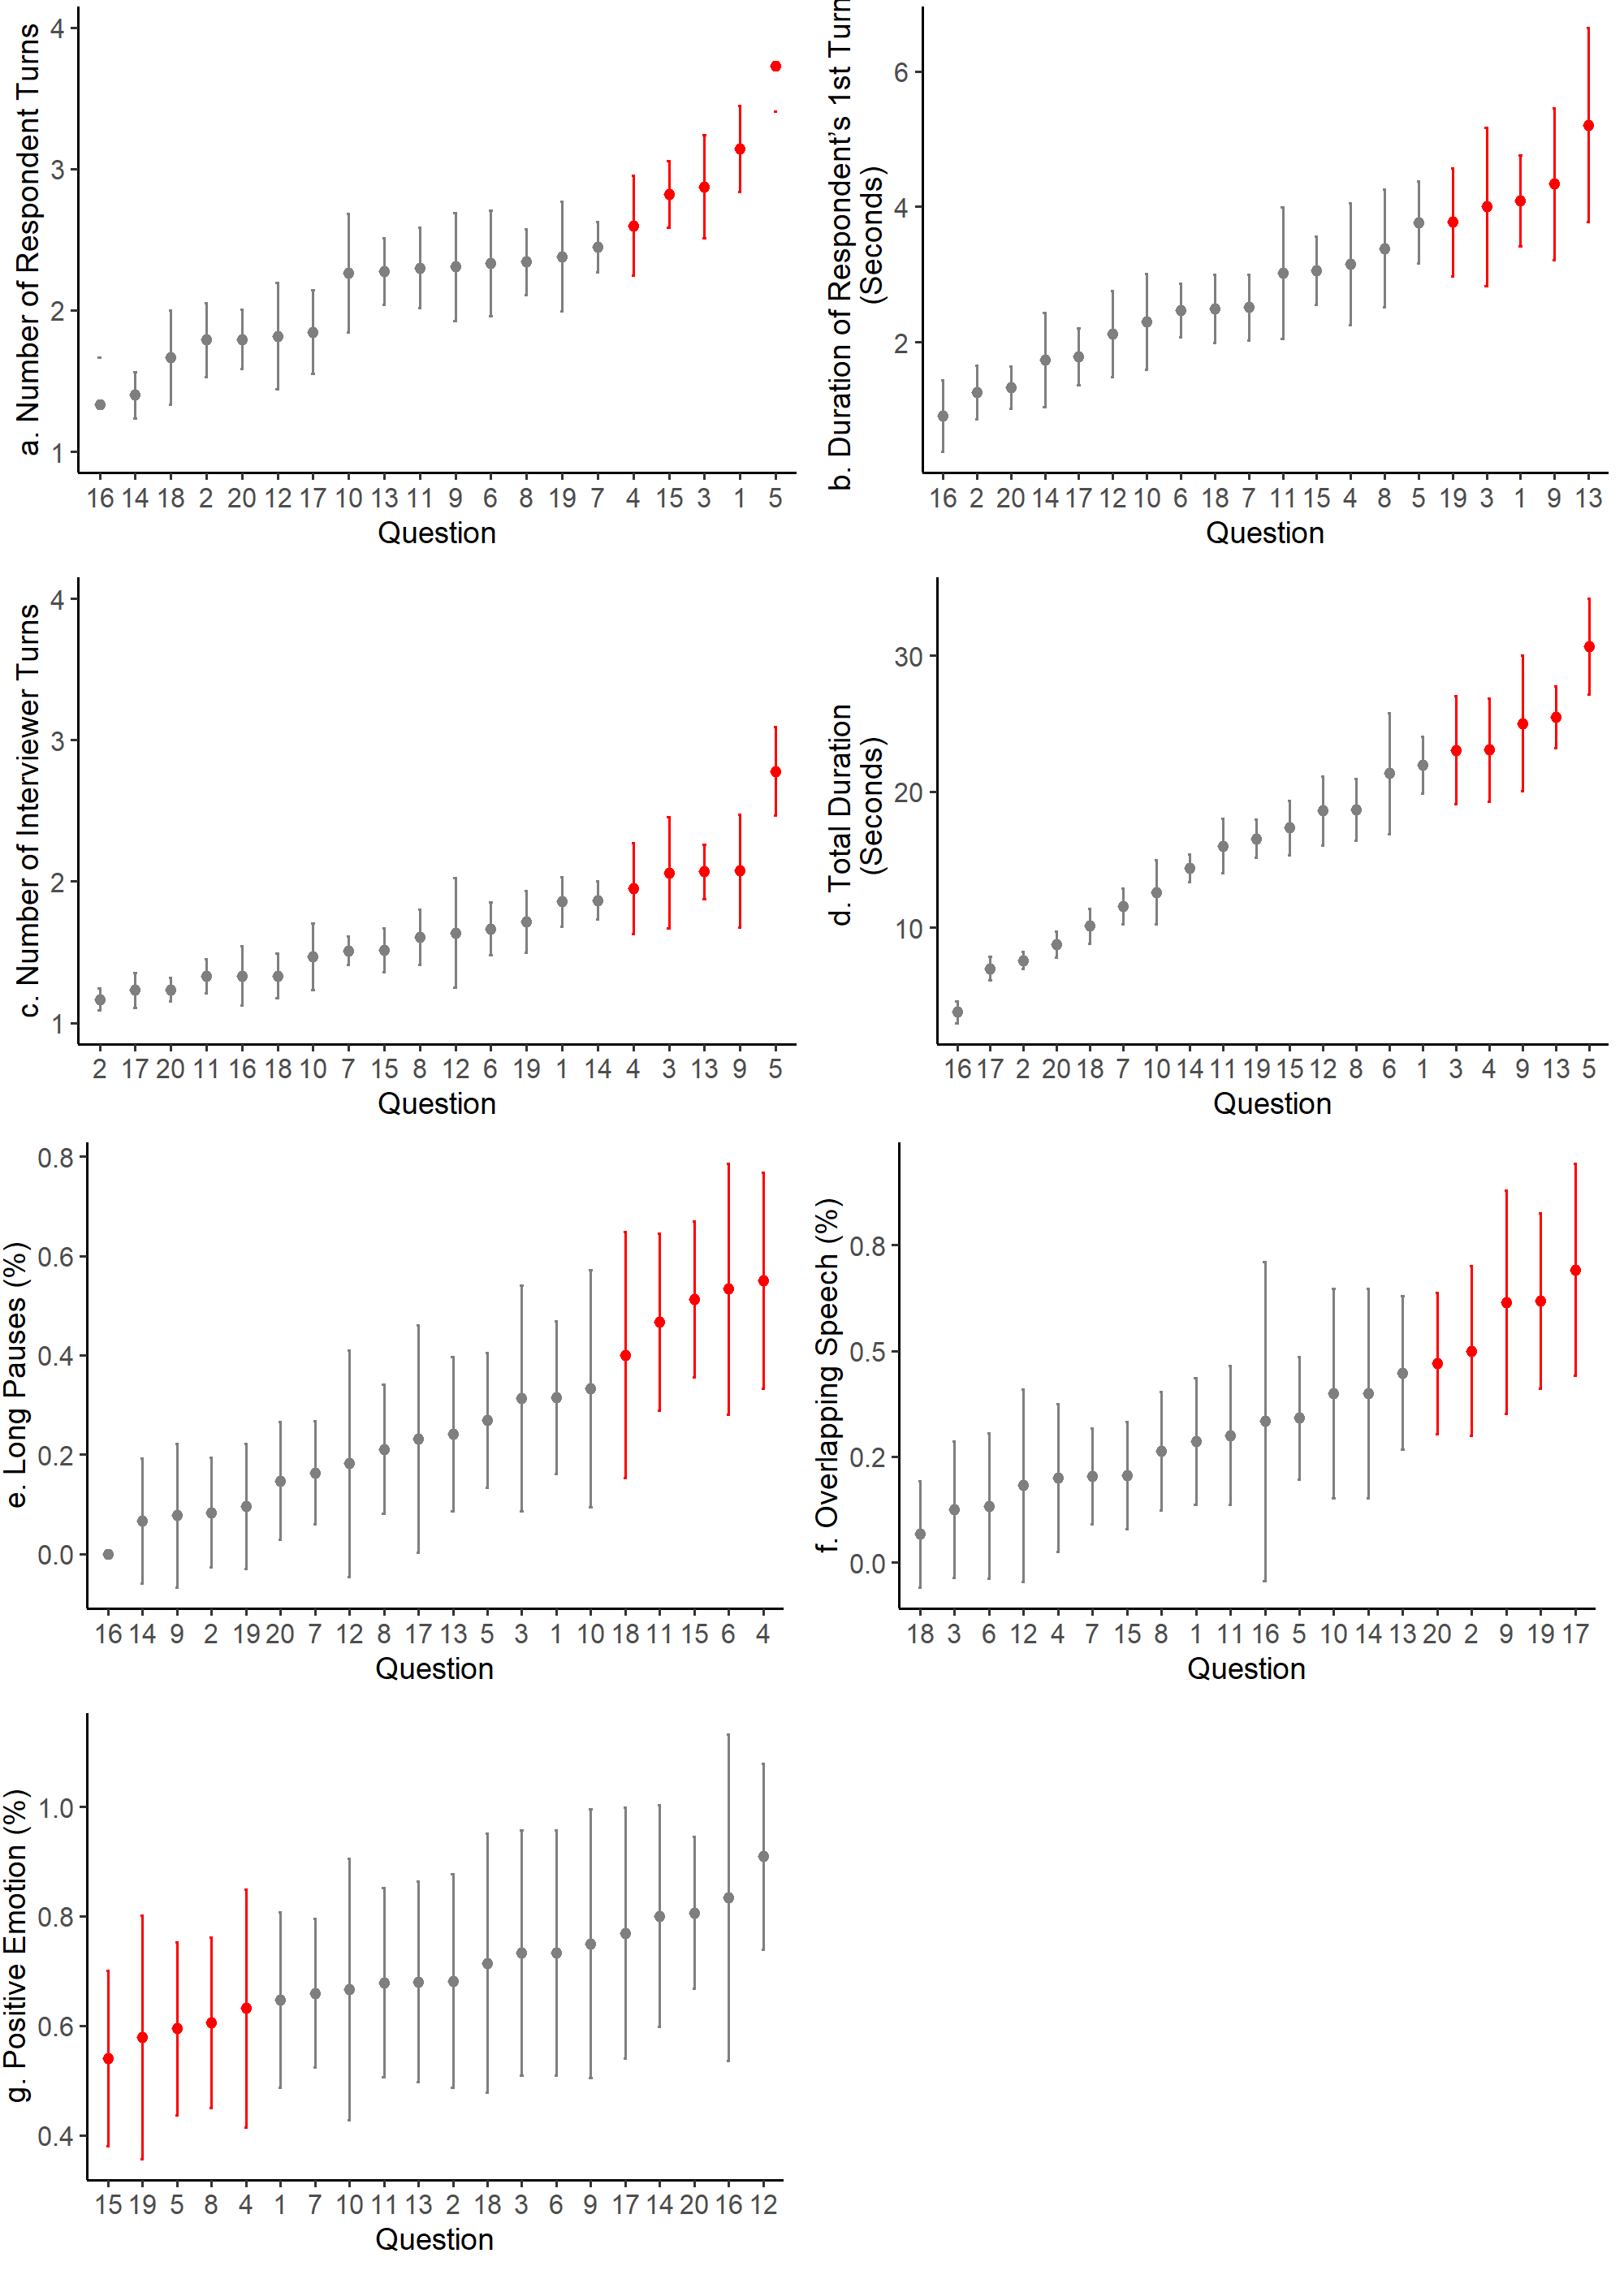
We ranked the 20 questions by each of the aggregated outcome measures and plotted them in Figure 2. Five questions with the worst performance on each measure are selected and marked in red.
Figure 2a presents the ranking of items by the number of respondent turns. The dots in the figure represent the mean number of respondent turns for that item and the spread is shown as the vertical line. Across the 20 items, the average number of respondent turn is 2.4 and the standard deviation is 1.6. Eleven questions had an average of two or more respondent turns and two questions had three or more respondent turns. As questions with more respondent turns are considered to have poorer performance, the top five questions with the most respondent turns are flagged as the worst performing items. We examined expert ratings for these five items. For four of them (Q3, Q4, Q9, and Q13), the mean difficulty rating provided by the two experts is 4.5, suggesting that the two experts considered them as difficult to answer as well. Q5 has a mean difficulty rating of 3.
Figure 2b displays the ranking of questions by the duration of respondents’ first turn. The average duration for the first respondent turn is 3.0 seconds (standard deviation is 4.0). Respondent spent an average of 5.2 seconds for their first turn for Q13, 4.3 seconds for Q9, 4.1 seconds for Q1, and 4.0 seconds for Q3. All four had a mean difficulty rating of 4.5. Q19 had a mean difficulty rating of 1.5, indicating that experts thought the question was easy. However, the average duration of respondents’ first turn is 3.8 seconds. An investigation of this question shows that Q19 is the next to the last question of the survey asking the respondent if they had any final comments about the survey. As it is an open-ended question, it is not surprising that it induced a longer first turn.
Figure 2c displays the question ranking by the number of interviewer turns. The mean number of interviewer turns across the 20 items is 1.7 (standard deviation is 1.1). Three questions (Q3, Q9, and Q13) had an average of 2.1 interviewer turns and a mean difficulty rating of 4.5. Q4 had an average of 2.0 interviewer turns and a mean difficulty rating of 4.5. Q5 induced 2.8 interviewer turns, making it the worst performing item using interviewer turn as an evaluation criterion. Expert rating is 3 for Q5.
Figure 2d presents the ranking of items by overall duration by question. The mean overall duration is 17.3 seconds (standard deviation of 15.5 seconds). Q5 – the question with the longest question-answering sequence – had an overall duration of 30.7 seconds and a mean difficulty rating of 3.0. The next four worst-performing questions (Q3, Q4, Q9, and Q13) had an overall duration of 23.0 seconds or more and a mean difficulty rating of 4.5.
Figure 2e presents the ranking of questions by the percent of recordings with long pauses as defined in Table 1. Across the 20 items, the average percent of recordings with long pauses is 27.1% (standard deviation is 44.5%). Q4 had long pauses more than half of the time (55.0%) and a mean difficulty rating of 4.5. Q6 and Q15 had an average percent of recordings with long pauses of 51.3% or more and a mean difficulty rating of 3. The average percent of recordings with long pauses for Q11 and Q18 is 46.7% and 40.0%, respectively; however, they were not coded as difficult by the experts.

Figure 2f displays the ranking of questions by the percent of recordings with overlapping speech. The mean percent of recordings with overlapping speech is 32.8% (standard deviation is 47.0%). Overlapping speech happened on 69.2% of recordings for Q17 and 61.5% for Q9; both had a mean difficulty of 4.5. Q19, Q2, and Q20 had an average percent of overlapping speech of 61.9%, 50.0%, and 47.1%, respectively; however, they all had a mean difficulty rating of 1.5 or lower.
Figure 2g presents the ranking of questions by percent of recordings with respondents exhibiting positive emotions. Across the 20 items, the average percent of recordings with positive emotions is 67.3% (standard deviation is 47.0%). As stated earlier, questions inducing fewer instances of positive emotions are considered problematic. The average percent of recordings showing positive emotions is 54.1% for Q15 (the average difficulty rating is 3 for this item). Q4 had an average percent of recordings with positive emotions of 63.2% and a mean difficulty rating of 4.5. The average percent of recordings with positive emotions for Q5 and Q8 is 59.5% and 60.5%, respectively; and both had a mean difficulty rating of 3. Q19 had an average percent of positive emotions of 57.9% and a mean difficulty rating of 1.5. Respondent fatigue might explain the low percent of positive emotions for Q19.
Conclusions and Discussion
We enhanced the CARI ML pipeline described in Sun and Yan (2023) to include additional measures that can be used to detect questions with worse performance. We presented six measures that can be used to flag interactional difficulties and breakdowns in the question-answering process. The seventh measure – positive emotions – enables researchers to examine challenges with question-answering process from emotional perspectives. The description of the measures and how they can be used for question assessment are listed in Table 1.
We tested the extensions of the pipeline on a sample of recordings from an establishment survey. A common set of questions were detected as problematic by multiple measures (as shown in Table 2). In particular, the results demonstrated a decent agreement between the seven measures and results from expert reviews. Specifically, all but one item with a difficulty rating of 3 or above were detected as one of top five worst performing items by at least one measure. These results demonstrated the potential of using our enhanced pipeline to screen items that might not be performing well and to prioritize the selection of these items for further evaluation (e.g., through conventional behavior coding).
Five items are worth noting because the expert ratings did not agree with the pipeline’s evaluations. Q16 is a numeric open-ended question requiring respondents to provide a count as the answer. The experts rated this item as a difficult question because they were concerned that respondents may not have the count information available and may need to resort to estimation that would reduce the accuracy of their answers. However, this item was not flagged as the worst performing item by any of the seven measures. It is possible that respondents did have the count information available and didn’t need to resort to estimation. It is also possible that the pipeline failed to detect it. Either way, this is a good example of when multiple question evaluation methods can complement each other and using more than one method could be more beneficial than relying on one, consistent with Tourangeau and colleagues’ recommendation (Tourangeau et al. 2020).
Q11 was considered by experts to be less difficult (the mean difficulty rating is 2.5) but was flagged by the long pause measure as one of the worst five items. This item is a closed-ended question and a showcard with 28 response options was provided to respondents. The experts judged that the mapping stage would be difficult for respondents. The long pauses between question reading and respondents answering reflected respondents’ reading of the showcard and choosing one option to report.
Three questions (Q2, Q19, and Q20) were considered to be not difficult by experts but were identified as the top worst performing items by at least one measure. As mentioned earlier, Q2 is the consent question asking respondents whether it is okay to record the interview. The higher percent of overlapping speech could be because respondents consented before the interviewer finished reading the question. Q20 asks the respondent how many people were needed to provide the information asked in the survey. The higher percent of overlapping speech could be because respondents already knew the answer and answered before the interviewer finished reading the question. Q19 was flagged by three measures (duration of respondent 1st turn, overlapping speech, and positive emotions) as one of the top worst performing items even though the experts did not think the question would be difficult to answer. This item was the last item in a 45-minute survey asking respondents if they had any final comments about the survey. Respondents started answering before the interviewer finished reading the question, took a longer time to provide verbatim answers, and experienced fewer positive emotions such as calm or happy. It could very well be that respondents were fatigued after 45 minutes. If our pipeline were used to select items for further testing and evaluation, the project team may want to make decisions on whether to include consent item and debriefing items in the pipeline. If they are not the focus of question assessment, these items could be simply removed from the pipeline.
The major limitation of this proof-of-concept study is that the recordings are from an establishment survey and questions are factual in nature. However, the mechanism of the pipeline as well as the use of metrics are applicable and appropriate for household surveys and can be used to assess the performance of attitudinal and behavioral items. We intend the pipeline to work for any interviewer-administered surveys. As a matter of fact, we have just applied the pipeline (and this set of metrics) to a household survey utilizing a multimode design including in-person, telephone, and live video interviewing (Edwards, Sun, and Yan, n.d.).
For this proof-of-concept study, expert reviews were used to validate the performance of the pipeline and experts’ rating of difficulty were considered as the benchmark for evaluation purpose. Of course, experts provide useful feedback but they are not always correct. They do produce false alarms (e.g., Tourangeau et al. 2020). To further improve the pipeline, we plan to conduct validation studies using results from conventional behavior coding and other evaluation methods to assess the performance of individual metrics, to identify characteristics of questions and circumstances of interviewing setting failed to be detected by individual metrics from the pipeline, and to improve the pipeline performance based on findings from the validation studies.
As a proof-of-concept, we used each of the seven outcome measures to rank the items. For future research, we will explore an optimal way to statistically combine these outcomes into a composite measure that will be more effective in identifying survey items with poor performance. We hope that the composite measure will make it easier for continuous monitoring and tracking of question performance.
The power of the pipeline lies in automated processing of a large number of recordings. As a result, the pipeline provides researchers and practitioners the flexibility to apply it in a large variety of settings. The pipeline can be used in pilot tests or a large data collection effort, during the first weeks of the field period, throughout the field period, or after data collection is completed. The pipeline can be used alone, in combination with other evaluation methods, or as a pre-processing step to efficiently select questions for further evaluation. We have provided technical details of our pipeline in this paper and Sun and Yan (2023). We encourage interested survey researchers to replicate our study and to use principles of the pipeline in their study for their particular goals of question evaluation and testing.
First author contact information
Ting Yan, 1600 Research Blvd, Rockville, MD, 20850, tingyan@westat.com