
1. Introduction
As the United States continues to diversify, researchers (academic, governmental, private) have increasingly seen the value of offering surveys in more than one language. The rise in multilingual surveying has brought new cognitive, cultural and psychological considerations (Lee and Pérez 2014; Peytcheva 2020; Sha and Gabel 2020) to the forefront of discussions on survey quality. While issues of translation quality and cultural competence have received ample attention, this paper highlights the importance of language at the individual item level.
Immigrant communities used to be expected to integrate linguistically just as they did socially and economically. In political science, researchers have used language competence as a proxy for acculturation (see Schwartz et al. 2010) among immigrant-based communities. However, work by Berry (1992) and Portes and Zhou (1993) suggests that acculturation and assimilation processes vary by individuals and contexts, leading to different cultural and linguistic outcomes. Language helps establish community and creates distinctive social markers in heterogeneous societies (Portes and Zhou 1993; also see Potowski 2018 for a review on language among Latinos in the United States). Recent phenomena like increased transnationalism and media globalization now makes the loss of an individual’s mother tongue less certain than in the previous century. In fact, academic papers written on Latinx politics often employ an expression in Spanish in the title as a social signal to readers.
Bilingual surveys and interviewers have proliferated across the public opinion world, allowing respondents to choose their interview language while maintaining consistency in other aspects. While the choice of language might be purely functional (i.e. proficiency), it is also possible that the choice is a social identity signal. Spanish was once avoided by immigrant families; but younger generations increasingly embrace it as a marker of social identity (Jenkins 2018; Mora and López 2023). While those proficient in the dominant language are likely to respond in it, 75% of the Latino population reports being able to carry on a conversation in Spanish (Mora and López 2023). This raises questions about how bilingual individuals make language choices in surveys (García Bedolla 2003; Mann, Michelson, and Davis 2020).
To explore language choice in surveys, I investigate language switchers in the Latino National Survey 2006 (LNS2006), a standard-bearer in political science research on Latines in the United States. Among its variables is one that tracks whether the respondent switched languages during the survey. By examining the demographic and attitudinal profiles of switchers, this paper aims to understand the forces shaping language choice in bilingual surveys.
In this brief analysis, I first show that, aside from educational attainment, language switchers’ demographics are similar to those who complete the survey in only one language. I then look at the attitudinal and identity profile of these language switchers and explore whether switching from Spanish to English is distinctive from switching in the opposite direction. I conclude by recommending that researchers and practitioners include data markers in surveys offered in more than one language to facilitate further exploration of language-related differences at the individual item level.
2. Background
Language has often provided a marker of both belonging and exclusion. Historically, in states with large populations of Spanish-speakers, Spanish was banned from the classroom and on some occasions led to a strong suppression of people’s mother tongue. This also reflects the experience of US-led English policies in Puerto Rico (see work by Dr. Alicia Pousada, i.e. Pousada 1996). In a sometimes-forgotten pivotal moment in the fight for human rights in south Texas, on November 14, 1968, a couple hundred Elsa-Edcouch High School students walked out of their school and garnered national attention in part because they were demanding to be able to speak Spanish, their parental and ancestral language, in their school. Despite earlier efforts to reduce the proliferation of Spanish among US-Educated Latinos, as well as a decrease in the immigrant Latine population, Spanish use remains widespread (Jenkins 2018). Furthermore, in reaction to the rise in ethno-nationalism in the United States many people from non-Anglo backgrounds have responded by reclaiming their names, if not their mother tongues (see Guerrero 2022). This points to an increase in the bilingual (+) population in the United States, who are able to codeswitch not only between accents and lexicons but also across languages depending on the context (Pérez Casas 2016). It is important to understand and unpack how answering in one language might be different from another in translated surveys that would otherwise purport to be equivalent (Lee and Pérez 2014).
Language of interview is related to differences in attitudes in English-Spanish surveys (Hill and Moreno 2001; see Lee and Pérez 2014 for an extensive analysis of language effects using the LNS2006; Welch, Comer, and Steinman 1973) as well as the accessibility of attitudes and concepts (Pérez Casas 2016). Velez, Saavedra Cisneros, and Gomez (2024) find that among bilingual individuals, language of administration impacts both scale and individual items statistical equivalence (on both difficulty and discrimination) for many, but not all scales explored in their paper, from identity to political knowledge (2024). Pérez (2011) shows that responding to surveys in different languages can be attributed to both differences in meaning (explored through differential item functioning) and differences in substantial views. However, the methodology employed in his 2011 study of language of response in the LNS2006 did not account for the possibility of respondents switching from one language to another. Thus, it is unclear what shapes response differences for those respondents who chose one language initially but then switched to another.
The task here is to disentangle these two factors, whether the choice of language in a survey is based purely on linguistic ability, suggesting response differences might be due to acculturation or linguistic differences, or whether language choice reflects something different, something more conscious and expressive rather than functional. The expectations can be stated as hypotheses:
H1. (assimilationist) A larger proportion of language switchers will start the survey in English and switch to Spanish due to proficiency constraints.
H2. (counter-assimilationist) A larger proportion of language switchers start the survey in Spanish then switch to English.
H3. (language-based) Respondents who start the interview in one language share traits and attitudes regardless of language switching throughout the interview.
H4. (identity-based) Spanish-only respondents share more attitudes with those who switch FROM Spanish than those who switch FROM English.
I next describe the dataset explored in this paper and how the inclusion of a variable that records if a respondent changed language during the interview can help us learn more about the choice of answering the survey in a particular language. I then explore differences across attitudinal variables to further interrogate the possibility that language of interview can also be a choice, based on respondent identity and views.
3. Data and measurement
3.1. The Latino National Studies
The Latino National Study 2006 (LNS-2006) remains the largest and most representative socio-political survey conducted on the Hispanic/Latine population in the United States. It was fielded between November 2005 and August 2006 with over 8000 completed interviews, stratified by geography where each state was a stand-alone representation of the state’s population (95% of Latinx population was included in the sampling population). Interviewers were 100% bilingual, providing CATI surveys in either Spanish or English (Fraga et al. 2006). The LNS-New England (Hu-Dehart et al. 2015) replicated the original LNS with samples of Latinos in Connecticut, Massachusetts, and Rhode Island. It contains 1200 completed responses (400 per state) and was in the field between November 2005 and August 2006. All the analyses are conducted without survey weights. The LNS-2006 dataset included a weighting variable; however, weights were unavailable for the LNS-New England. The next section begins by describing the process of choosing language of interview and how language switching was recorded. After this brief description, we compare the demographic profiles for the different types of respondents. We then compare identities and political attitudes across the groups.
4. Results
4.1. Language Switching in the LNS 2006 and LNS-New England
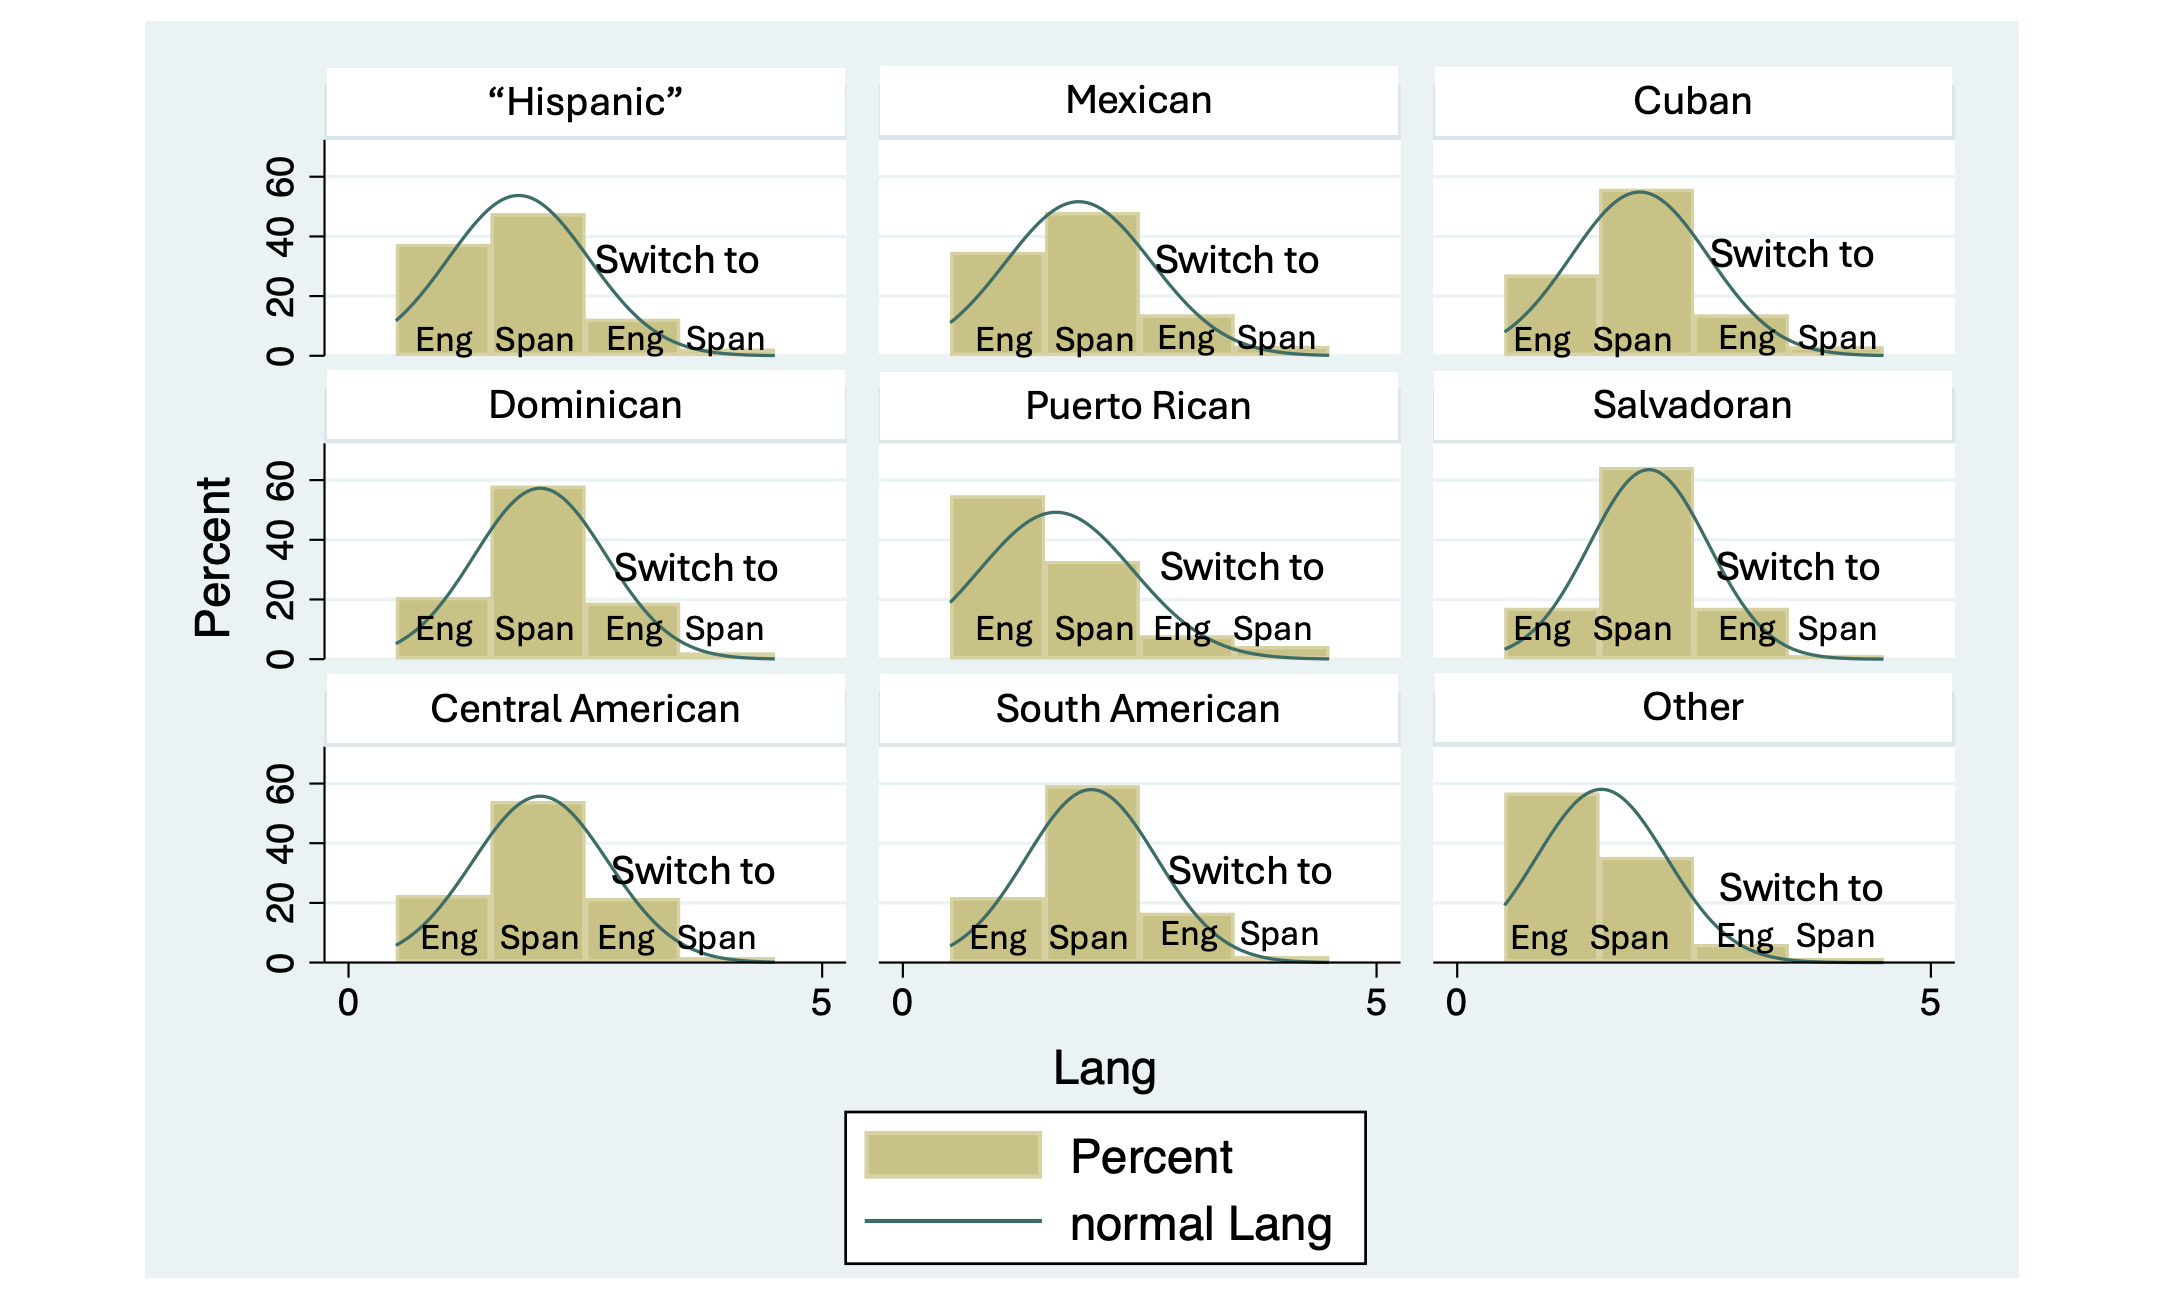
At the beginning of the CATI survey, “respondents were greeted in both languages and were immediately offered the opportunity to interview in either language” (Fraga et al. 2006) and asked the question: "Would you prefer that I speak in English or Spanish?/ ¿Usted preferiría que yo hable en inglés o en español?". Immediately afterwards, interviewers read the consent script in the respondent’s chosen language. While there were no explicit instructions telling respondents they could shift languages during the interview, 1656 respondents switched their language during the survey interview, this accounts for 16.8% of the total sample. Language switching was recorded by a single question asked to the interviewer at the conclusion of the survey. This high level of switching might be attributed to lack of proficiency from respondents, particularly given the fact that the LNS surveyed 6,350 Latines born outside the United States. H1 predicts that most language shifting should occur from English to Spanish, and likely be more prevalent among those born outside of the United States (Spanish-dominant countries). At first glance this appears to be true, more foreign-born respondents switched languages (19.7%) during the interview than did those born in Puerto Rico (16.2%), who in turn were more likely to switch than Mainland-United States born respondents (10.2%) (6) = 3600, p > .0001). Both Puerto Rico and mainland-born respondents are statistically significantly less likely to switch language than foreign-born respondents at the p ≤ .001 level.
We might expect those who switched languages to be more recent arrivals to the United States and to be older. There were no age differences between the foreign-born respondents who switched and those who did not, and their time of arrival differed by less than half a year. This seems to cast doubt on the idea that linguistic ability is related to the switching of language throughout the interview. A traditional measure of acculturation used when studying foreign-born populations is naturalization. The difference in switching language between naturalized (17.8%) and non-naturalized immigrants (20.7%) was less than three percentage points, and while statistically significant (Z= 4.16, p > .001), it is not as striking as would be expected from a purely acculturation mechanism. Additionally, those answering in English reported high Spanish proficiency over 80% of the time (81.3% for non-switchers, 75.5% for switchers), while only about one-third of those respondents answering in Spanish reported high English proficiency. Most interestingly, over four times as many switchers preferred to start the interview in Spanish than in English, suggesting that switching may not be due to a lack of English (H1), but rather due to their proficiency in Spanish (H2) (see Table 1).
4.2. Demographic Descriptive Results
Based on the language of interview chosen by the respondent, as well as whether or not they switched languages during the interview, four different groups were created and are compared quantitatively in Table 1. Those who started and completed the interview in (a) English, (b) Spanish, and those who switched language from (c) Spanish to English (started in Spanish), and (d) from English to Spanish (started in English). There was no clear geographic concentration of any given group; their proportions are commensurate with the sample size at the state level. Table 1 presents descriptive demographic statistics about each group. The columns are organized around the initial language of interview, then subdivided into those who switched language throughout the interview and those who did not. The variables explored are age = 40.8, s.e.=.16), % female (55%), Nativity (Born on mainland United States, Puerto Rico, or other country), proficiency in second language (4pt scale from not at all, to native fluency), household income (7pt scale from very liberal to moderate to very conservative), home ownership (binary), and four categories of educational attainment. For those born outside the United States, I explore naturalization (citizenship) (65.7%) and years in the United States = 19.4 years, s.e.=.17).
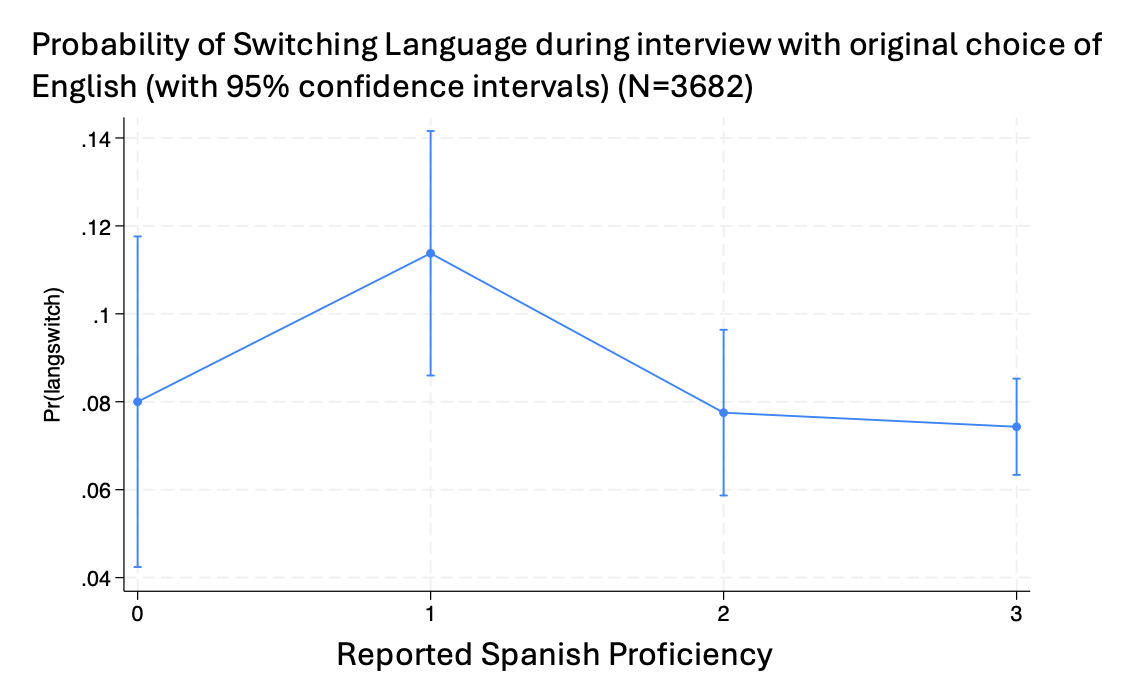
The variables explored appear to cluster by the language in which respondents started the interview, rather than the language to which they changed. As expected, respondents starting the survey in English were much more likely to have been born in the United States or to be naturalized citizens than those who started in Spanish. They tended to have much higher levels of education and homeownership. Reported proficiency in the language not chosen for the interview showed asymmetrical effects. Switchers who started in English showed no significant differences from those who did not switch languages (Appendix C displays the nonlinear effects of proficiency on the likelihood of switching language). For respondents starting in Spanish, those who switched language reported higher levels of English proficiency than those who did not (t=2.62, d.f.=2054, p<.01). This is puzzling because there were no consistent or large differences between those who switched and those who did not.
4.3. Attitudinal and Identity Analyses
Table 2 shows estimates for a series of attitudinal and identity variables across the four groups along with standard errors. All variables are coded 0 to 1; except for ideology, coded -1 (extremely liberal) to 1 (extremely conservative), with 0 as the midpoint of the 7-point item. Table 2 conducts pairwise tests across language groups rather than global significance tests (all ANOVAs are statistically significant at the p < .001 level) to compare each language group (language preference and switching) to all others.
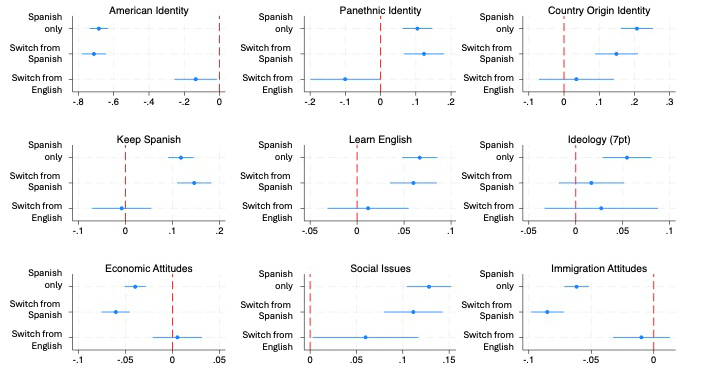
The first row shows group differences on strength of identity variables, with all being single-item 4-point variables (American, Latino, Country of origin), with the exception of the Latinx identity variable (a 9-item validated scale, Saavedra Cisneros 2017). Group differences in Table 2 track those in the previous table. Respondents who started in English reported much higher levels of American identity than those who started in Spanish. Interestingly, those who started in English and then switched to Spanish reported lower levels of American identity than those who did not switch, providing some support to H3 and H4. On Saavedra Cisneros’ (2017) Latinidad variable, created from items of commonality and linked fate in the LNS2006, we see a similar pattern. Those responding in English had lower levels of identity than those answering in Spanish; here however, those who started in Spanish and then switched reported significantly higher levels of Latinidad than those who just answered in Spanish.
Country of origin identity behaved as would be expected by acculturation and assimilation explanations. Those answering in Spanish felt more identified with their countries of origin than those answering in English. Respondents overall reported high levels of panethnic identity (“how strongly do you identify as Latina/o/Hispanic?”), but those who started in English reported lower levels of panethnic identity. Here again, those switching from English had a lower sense of panethnic identity than those who did not switch. The difference is marginally significant once we introduced covariates (Age, Education, Generation, and Sex) in a regression (see Figure 1 for marginal effects across the language categories).
The second row of coefficients explores attitudinal differences across the groups. Here, similar patterns emerged, with some notable exceptions. While a large proportion of the sample believed that it is important to keep Spanish among Latinos, Spanish respondents see it as even more important than English respondents. On the question of the importance of learning English, English respondents reported lower levels of support, while still being overwhelmingly positive. On ideology (7-point item, recoded from -1, very liberal, to 1, very conservative), Latinos answering in Spanish reported being more conservative than those answering in English, with those switching languages falling in between the two groups. All groups, however, were very close to the scale midpoint (0) and showed less than a 10% distance across each other.
The final row presents issue attitude variables, which are scaled (a principal components analysis yielded three latent constructs across the eight issue questions, see Appendix B) from 0 (most liberal, pro-immigrant) to 1 (most conservative, anti-immigrant). Here the results track the acculturation explanation advanced by Branton (2007). Those responding in English were more conservative on economic and immigration issues and more liberal on social issues. Again, those who switched language appear to be in between those who answered the survey in only one language, but the differences do not seem strikingly distinct.

5. Discussion
Results from this exploratory analysis are somewhat puzzling. Demographically, those starting the survey in each language look much alike, regardless of whether they changed language throughout the survey. The results for the identity and attitudinal variables align with the traditional language-of-interview as acculturation explanation, though small but significant differences exist between those who switched languages and those who completed the survey in a single language. Because of survey branching, questions related to proficiency and bilingual programming in schools and communities were not asked of the whole sample. This highlights the fact that researchers lose richness and the ability to learn more about their populations of interest when they make assumptions about why an individual chooses a language at the beginning of a survey.
Unfortunately, the question of Spanish proficiency was only asked of those who started the interview in English. Those who started in Spanish but switched language were not asked about their proficiency. Even more lamentable is the fact that questions regarding English-as-a-second-language (ESL) programs were only asked to respondents who started in Spanish. The logic for omitting the question for those starting the survey in English makes sense, but this research project shows that these – and others – are interesting questions about language and identity that should be considered in future research. Last, while the LNS2006 provides information on whether respondents switched languages throughout the survey, we do not know when, or if they switched back.
It is possible that the interviewers themselves could have been a factor behind the switching of language throughout the interview. This would be hard to ascertain given that the LNS employed fully bilingual interviewers and there is no information on the sociolinguistic background of each interviewer. An additional consideration is how the mode of interview might shape responses from different populations of interest. How might a face-to-face versus a telephone versus an online survey impact the language choices of this diverse and growing group in the United States? Face-to-face and telephone surveys might help our understanding of political attitudes and behaviors if we have more information about the interviewers, from background, to accent, to country of origin, all of these are potential confounds that might have large implications for our understanding of multilingual Americans (Adida et al. 2016).
The LNS-2006 is almost 20 years old. Many social, political, and demographic changes have occurred in the United States since this dataset was originally collected. One of the valuable innovations introduced by the LNS-2006 was to track whether respondents switched languages throughout the interview. Researchers have also paid increasing attention to language effects in political studies. While the results presented here provide mixed support for many distinct theoretical expectations, what appears clear is that the language in which a respondent answers a question is important. Given the advances in technology and increased concern for data quality, it is crucial that datasets include information about not only which language the survey was started in, but also about the language of each individual question. I was unable to find any other large dataset that included this crucial bit of information. Today, surveys administered online could do this easily; in addition, CATI and face-to-face surveys might be able to implement small changes that allow interviewers to note whether a question was asked in a language other than the initial one chosen.
Lead author contact information
Angel Saavedra Cisneros
Bowdoin College
a.saavedra@bowdoin.edu
Hubbard Hall 19
9800 College Station
Brunswick, ME 04011-8498